I am grateful to Waterways Ireland for sending me the Shannon traffic figures for the last three months of 2014. They sent them last month but I didn’t have time to deal with them until now.
Regular readers may wish to skip this section
All the usual caveats apply:
- the underlying figures do not record total waterways usage (even for the Shannon) as, for instance, sailing, fishing or waterskiing on lakes or river stretches, which did not involve a passage through a lock or Portumna Bridge, would not be recorded
- the passage records would not show, for instance, a change in the balance of types of activities from those in larger cruising boats to those in smaller (sailing, fishing, waterskiing) boats
- figures like these will not necessarily be representative of those for the year as a whole. The winter months, January to March, see little traffic in any year; for April, May and June, the weather can have a large influence on the amount of activity especially, I suspect, in private boats.
On the other hand, the figures do include the Shannon’s most significant tourism activity, the cruiser hire business. And they are our only consistent long-term indicator of usage of the inland waterways.
All boats
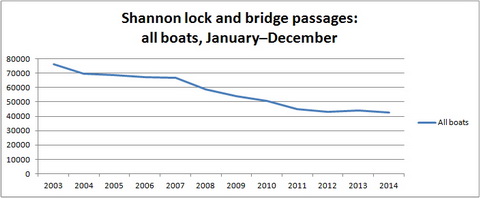
Total (private + hired) traffic for the full year
As we saw in September, traffic is down on 2013, but there has been little change over the last three years.
Private boats
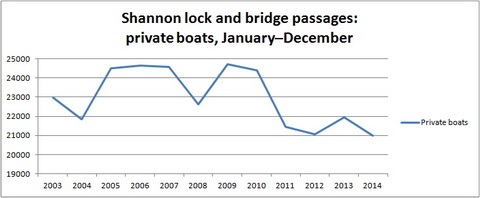
Private-boat traffic for the full years 2003 to 2014
The vertical scale on this chart is different from that for hired boats so the changes in private boating from one year to another are exaggerated (by comparison). The good weather did not prevent a fall in activity.
Hire boats
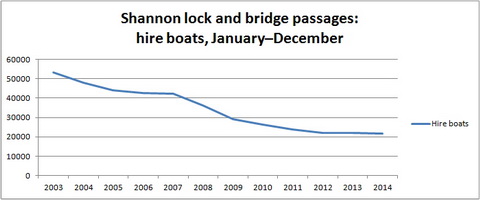
Hire-boat traffic for the full years 2003 to 2014
Again, the lowest figure in my records, but the drop was small; perhaps the hire trade is bouncing along the bottom (as it were). I wonder whether anyone has a Grand Plan for recovery or rejuvenation.
Percentages of 2003 levels
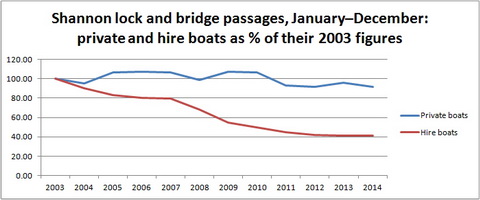
Percentages of 2003 levels
Private traffic at just over 90% of 2003 levels, hire traffic at just over 40%.
Private -v- hired
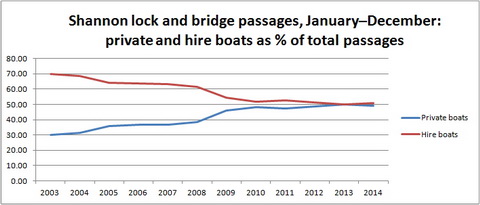
Still roughly 50:50
Seasons
In the five months January, February, March, November and December, there were 385 passages altogether, less than 1% of total boat movements for the year. If money can be saved by ceasing to operate the locks and bridge during the winter, they should be closed except, perhaps, for one Saturday per month, to be arranged for a non-flood day.
Regions
Here is the order of popularity.
| ALBERT LOCK | 7205 |
| ATHLONE LOCK | 5775 |
| CLARENDON LOCK | 5650 |
| ROOSKY LOCK | 5565 |
| PORTUMNA BRIDGE | 5395 |
| VICTORIA LOCK | 4934 |
| TARMONBARRY LOCK | 3885 |
| POLLBOY LOCK | 1222 |
| CLONDRA LOCK | 1020 |
| BATTLEBRIDGE | 835 |
| DRUMLEAGUE | 797 |
| DRUMSHANBO LOCK | 387 |
| SARSFIELD LOCK | 97 |
Lough Allen is a delightful place but it is not popular.


Pingback: Shannon traffic December 2014 | Canals of Dublin – Tourism Information
Pingback: Shannon–Erne Waterway traffic | Irish waterways history