Tag Archives: Albert Lock

Shannon traffic figures to December 2014

I am grateful to Waterways Ireland for sending me the Shannon traffic figures for the last three months of 2014. They sent them last month but I didn’t have time to deal with them until now.

Regular readers may wish to skip this section

All the usual caveats apply:

  • the underlying figures do not record total waterways usage (even for the Shannon) as, for instance, sailing, fishing or waterskiing on lakes or river stretches, which did not involve a passage through a lock or Portumna Bridge, would not be recorded
  • the passage records would not show, for instance, a change in the balance of types of activities from those in larger cruising boats to those in smaller (sailing, fishing, waterskiing) boats
  • figures like these will not necessarily be representative of those for the year as a whole. The winter months, January to March, see little traffic in any year; for April, May and June, the weather can have a large influence on the amount of activity especially, I suspect, in private boats.

On the other hand, the figures do include the Shannon’s most significant tourism activity, the cruiser hire business. And they are our only consistent long-term indicator of usage of the inland waterways.

All boats

Shannon 2003-2014 01-12 all boats_resize

Total (private + hired) traffic for the full year

As we saw in September, traffic is down on 2013, but there has been little change over the last three years.

Private boats

Shannon 2003-2014 01-12 private boats_resize

Private-boat traffic for the full years 2003 to 2014

The vertical scale on this chart is different from that for hired boats so the changes in private boating from one year to another are exaggerated (by comparison). The good weather did not prevent a fall in activity.

Hire boats

Shannon 2003-2014 01-12 hired boats_resize

Hire-boat traffic for the full years 2003 to 2014

Again, the lowest figure in my records, but the drop was small; perhaps the hire trade is bouncing along the bottom (as it were). I wonder whether anyone has a Grand Plan for recovery or rejuvenation.

Percentages of 2003 levels

Shannon 2003-2014 01-12 compared with 2003_resize

Percentages of 2003 levels

Private traffic at just over 90% of 2003 levels, hire traffic at just over 40%.

Private -v- hired

Shannon 2003-2014 01-12 private -v- hired_resize

Still roughly 50:50

Seasons

In the five months January, February, March, November and December, there were 385 passages altogether, less than 1% of total boat movements for the year. If money can be saved by ceasing to operate the locks and bridge during the winter, they should be closed except, perhaps, for one Saturday per month, to be arranged for a non-flood day.

Regions

Here is the order of popularity.

ALBERT LOCK 7205
ATHLONE LOCK  5775
CLARENDON LOCK 5650
ROOSKY LOCK 5565
PORTUMNA BRIDGE 5395
VICTORIA LOCK 4934
TARMONBARRY LOCK 3885
POLLBOY LOCK 1222
CLONDRA LOCK 1020
BATTLEBRIDGE 835
DRUMLEAGUE 797
DRUMSHANBO LOCK 387
SARSFIELD LOCK 97

Lough Allen is a delightful place but it is not popular.

Shannon traffic 2013

Some weeks ago Waterways Ireland kindly supplied me with the Shannon traffic figures for the final three months of 2013 and I have just now had a chance to add them to my spreadsheets and produce some graphs.

The usual caveats apply: the underlying figures do not record total waterways usage (even for the Shannon) as, for instance, sailing, fishing or waterskiing on lakes or river stretches, which did not involve a passage through a lock or Portumna Bridge, would not be recorded. The passage records are our only consistent long-term indicator of usage of the Shannon but they would not show, for instance, a change in the balance of types of activities from those in larger cruising boats to those in smaller (sailing, fishing, waterskiing) boats. On the other hand, they do include the Shannon’s most significant tourism activity, the cruiser hire business.

It is good to note, incidentally, that, in its draft Corporate Plan 2014–2016, Waterways Ireland says that it intends to

Develop and implement a research programme to measure waterway usage and inform planning and development.

It won’t be easy to do, but we need much better measures of all types of activities on all seven of the waterways managed by WI.

The final outcome for 2013 won’t greatly surprise anyone who has read earlier bulletins on this subject, like this covering the figures to end-September 2013. All the illustrations are based on information supplied by Waterways Ireland, with some minor adjustments by me to eliminate anomalies, but the interpretation and comments are mine own.

All boats full year

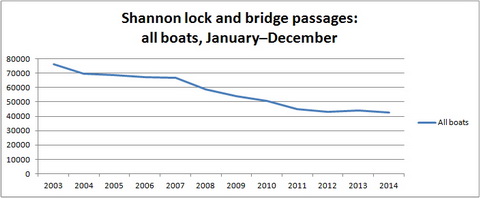
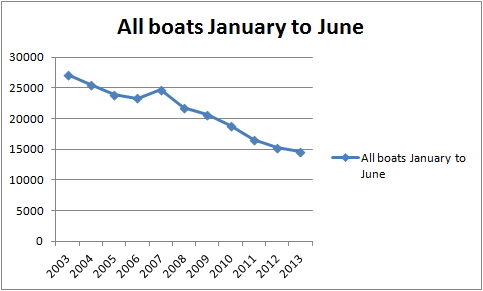
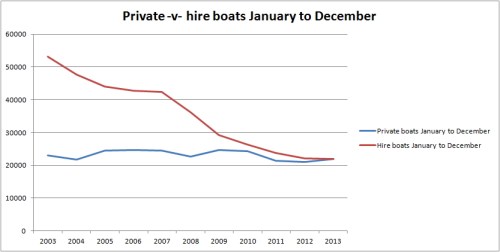
Total Shannon traffic 2003–2013, private and hired

The decline in traffic since 2003 seems to have been halted …

All boats full year %

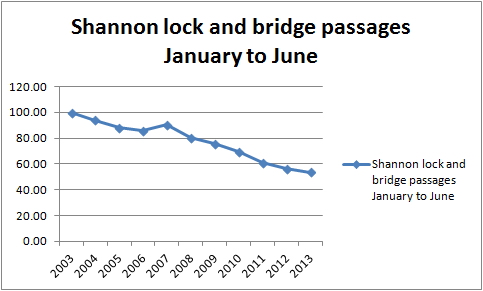
Total Shannon traffic as a percentage of 2003 traffic

… but it is 40% below what it was in 2003.

Private boats full year %

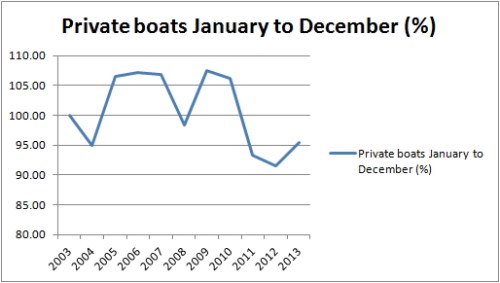
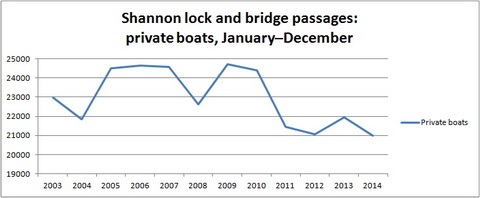
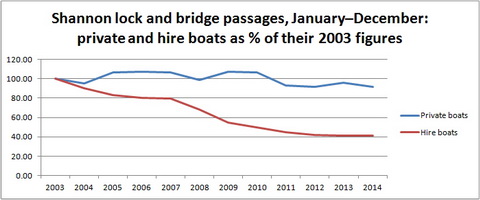
Private-boat traffic 2003–2013 as a percentage of 2003 traffic

Traffic in private boats seems to be recovering, but what is perhaps more significant is that it never went more than 10% above or below the 2003 figure. It has been remarkably stable over the period, despite the economic crash and despite the anecdotal evidence of boats being sold to overseas owners and trucked out of the country. Perhaps larger boats were replaced by smaller? Perhaps only boats bought in the boom were sold in the bust? Unfortunately the deficiencies of the registration system make it very difficult to determine what has been happening.

Hire boats full year %

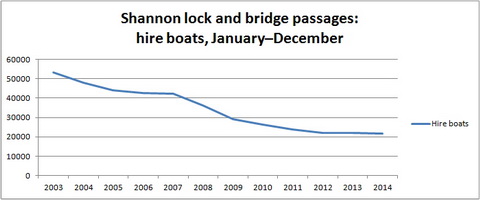
Hire-boat traffic 2003–2013 as a percentage of 2003 traffic

But if private-boat traffic has been remarkably stable since 2003, the same cannot be said of hire-boat traffic. The best that can be said of 2013 is that the figures didn’t get [much] worse, but a 60% decline since 2003 is really, really dreadful.

WI’s draft Corporate Plan, which does not explicitly mention the hire industry, talks of

… unlocking opportunities to achieve recreational growth, and economic and social development.

I don’t know whether that omission means that WI sees little prospect of a rejuvenated hire-boat industry. And I note that, other than in the titles of organisations, the draft plan rarely mentions tourism or tourists. Are the waterways only for natives? If so, is that a deliberate policy decision? Or is there something that could be done, cheaply, to help to revive waterways tourism?

Emma Kennedy, writing in the Sunday Business Post on 23 February 2014, wrote about Fáilte Ireland’s latest brainwave, which is to “target” three groups:

  • social energisers, which are gangs of young people interested in “new and vibrant destinations”, which I take to mean Temple Bar
  • culturally curious folk aged 50 or over, with money, who are interested in “exploring new landscapes, history and culture”
  • great escapers, who like energetic rural holidays with their partners.

No families with kids, I see, although “Families & Loved Ones” (the latter term, by the way, nowadays seems to mean either dead people or their relicts) were one of the two “primary target customer segments” identified in Fáilte Ireland’s Inland Cruising Market Development Strategy. (Fat lot of good that strategy did, but we mustn’t be bitter.)

Anyway, without having done any market studies (though WI has funded lots of them), it seems to me that there is scope for more tourism on the waterways, but it might not be on traditional cruisers. It might involve outdoor activities like cycling and walking along the canals and Barrow: WI’s plan discusses them, but without adverting to an overseas market. And it might involve small-boat activities — canoeing, touring rowing, small-boat sailing, camping — on Shannon, Erne and SEW: WI says it will support micro-enterprises, and those providing outdoor activity holidays may need expertise and assistance rather than hard cash.

I admit to having little evidence on this, but it seems to me to be too early to give up on the tourism potential of the waterways. And the decline of the cruiser hire business does not necessarily mean that all waterway tourism is doomed.

Private -v- hire full year

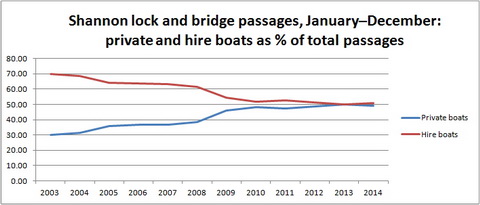
Private boats overtake hire boats

That said, 2013 was the year when, for the first time since Noah was an Able Seaman, the number of passages by private boats exceeded that by hire boats.

Checkpoints 2013

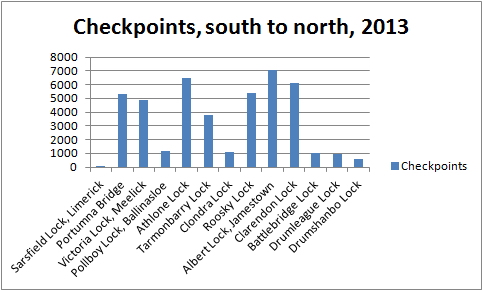
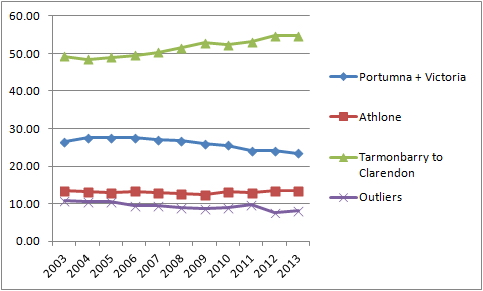
The points at which numbers were recorded

Finally, this chart suggests that any structures that were not built by the Shannon Commissioners in the 1840s will not attract many visitors. The extensions off the main stem of the Shannon — south to Limerick, west to Ballinasloe, east through Clondra, north to Lough Allen — are much less used than the main line from Lough Derg to Lough Key. It seems unlikely that any further extensions, especially to small towns that it would take three hours (at canal speed) to get to, are likely to be any more successful in attracting traffic.

Shannon traffic to June 2013

The figures for Shannon lock passages to the end of June 2013 are now available. The decline continues, though perhaps more slowly.

Shannon traffic Jan to June percent

Shannon lock and bridge passages January to June as percentages of the 2003 number

The usual caveats apply: the underlying figures (kindly supplied by Waterways Ireland) do not record total waterways usage because, for instance, sailing, fishing or waterskiing on lakes or river stretches, which did not involve a passage through a lock or Portumna Bridge, would not be recorded. The passage records are our only consistent long-term indicator of usage of the Shannon but they would not show, for instance, a change in the balance of types of activities from those in larger cruising boats to those in smaller (sailing, fishing, waterskiing) boats. It is quite possible, therefore, that overall usage might be increasing while long-distance cruising was declining.

Shannon traffic Jan to June private

Shannon lock and bridge passages by private boats January to June

As it happens, the figures show a small increase over 2012 in passages by private boats. I suspect that July’s warm weather will spur a further increase.

Folk living in Ireland, whether owners or prospective hirers, are likely to be able to react quickly to better (or worse) weather by doing more (or less) boating; folk living abroad may be less able to change their holiday plans. Accordingly, July’s weather might (I’m speculating here) mean an increase in passages by private boats and by boats hired by Irish residents; it might not lead to an increase in hiring from abroad.

Traffic in hired boats continued to decline in June.

Shannon traffic Jan to June hire

Shannon lock and bridge passages by hired boats January to June

That decline outweighed the small increase in private traffic, leading to an overall decline in the first six months as compared with the same period in 2012, which itself continued the pattern set in 2007.

Shannon traffic Jan to June all

Shannon lock and bridge passages by all boats January to June

I wondered whether the figures might show any change in the geographical distribution of activity. WI’s reports don’t show separate figures for private and hired boats for the individual locks, but it seems to me that the hire business is becoming more concentrated on northern waters, from Lough Ree upwards. If that is so, then there might be an increase in the proportion of passages through the northern locks, from Tarmonbarry upwards, and a decrease in the proportion passing through Portumna Bridge and Meelick (Victoria) Lock.

I put the WI reporting stations in four groups:

  • Portumna + Meelick
  • Athlone
  • Tarmonbarry, Clondra, Roosky, Jamestown (Albert), Knockvicar (Clarendon)
  • the also-rans: the three locks leading to Lough Allen, Pollboy leading to Ballinasloe, the Limerick sea-lock (Sarsfield).

The figures suggest that the distribution is indeed changing, but gradually rather than dramatically. Athlone’s figures are pretty steady, the outliers are declining slightly and Portumna + Meelick are declining a bit more; the northern locks (Tarmonbarry to Knockvicar) are taking the gains. Comments or alternative interpretations welcome.

Change by region

Lock passages by group

The figures for 2013 are for the six months January to June; those for other years are for twelve months.

The locks could of course be grouped in other ways, and I may try some of them in future months.

Lock sizes on the Shannon Navigation

Some figures.